Instant, Intelligent Event Logs
Lavawall® not only provides instant access to event logs, but also analyzes them for you and shows you how often the error occurs!In the device detail screen, click the log icon tab.
Note: if this tab is missing, the device did not have any logs for Lavawall® to collect.
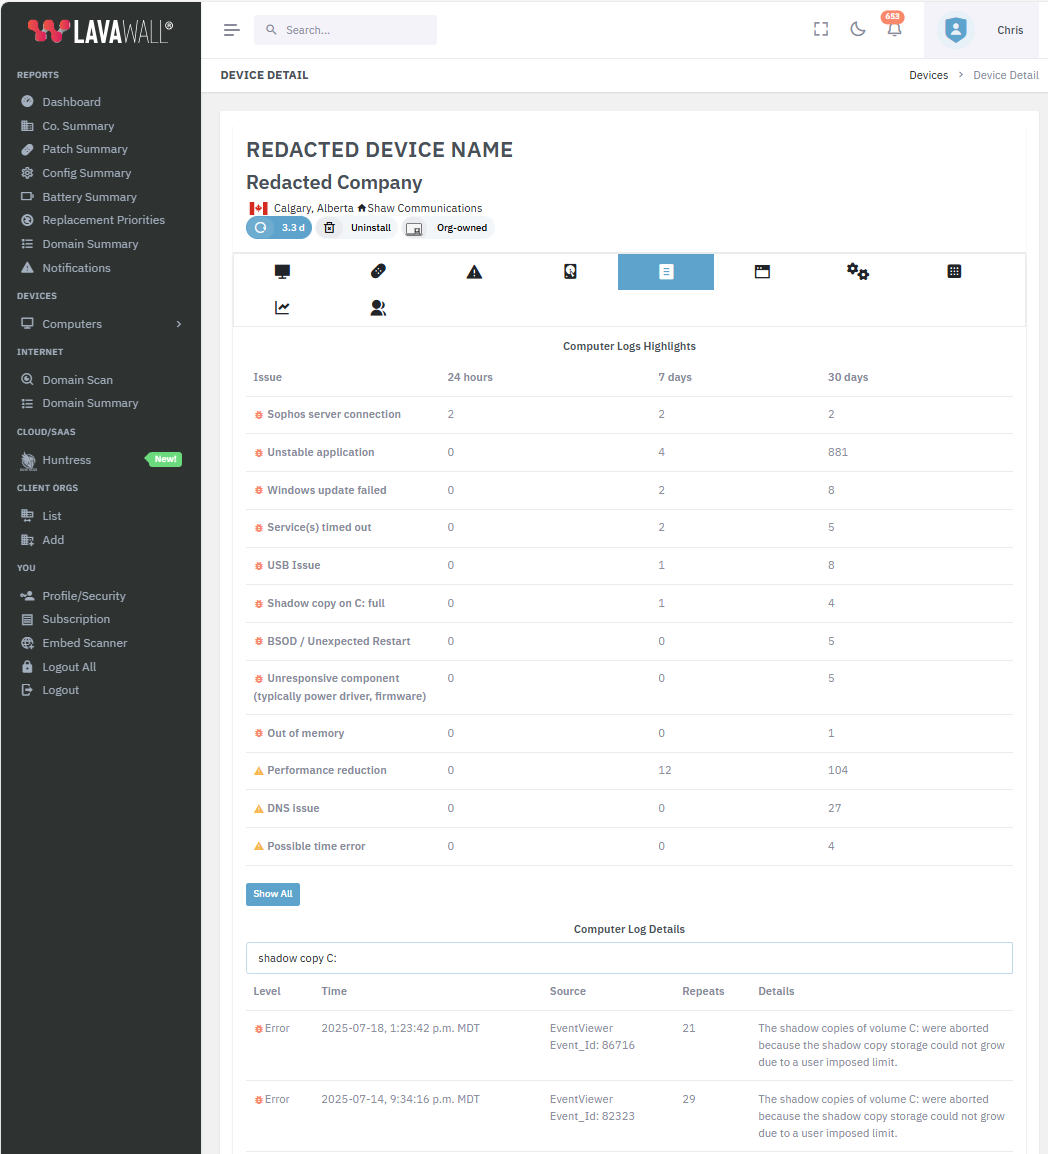
The top part of the view shows highlights from the logs. These are key issues that Lavawall® found. It shows how often the type of error has occurred within the last 24 hours, 7 days, and 30 days.
If you click one of the Computer Logs Highlights rows, the search box will get automatically filled in and the detailed logs will show.
The listed Time is the last time this error occurred. The Repeats column shows how many times Lavawall® has observed this problem.
When the details page initially loads, only the most recent few hundred logs load. As you type in the search field, Lavawall® will filter the loaded events with every keystroke.
If Lavawall® has more log entries for this computer than it could quickly load when the details loaded, you will see a Search All button in the search field.
Pressing Enter or clicking Search All will search all of the log entries that Lavawall® has observed.
You’ll never have have to wait for your RMM to connect and pull up event viewer again!
Best of all, you’ll get notifications for BSOD and other events that affect your clients, so you can demonstrate great support by reaching out to them to solve the problem instead of them being frustrated in silence or filling your ticket logs with low CSAT scores.
You can also quickly check to see which other computers are affected and search for issues with sensible words like "graphic" instead of figuring out that bugcheck 0x0000019c means a BSOD that is usually caused by a graphical component that didn’t power on because of a problem in a dock, for example.
Process, Event, and System Change Notifications
Event logs, process resource utilization, and device changes trigger event-based notifications, including the following:Note: this is not an exhaustive list. We continuously add new notifications based on changes we see in the wild
- Huntress incidents
- Reboot Required
- Device moved to a residential Internet connection
- Patching blocked
- High CPU utilization
- High RAM utilization
- High Temperature
- C: full
- Antivirus issue
- Process performance
- Chrome Browser resource utilization
- Edge Browser resource utilization
- Opera Browser resource utilization
- Safari Browser resource utilization
- Brave Browser resource utilization
- Firefox Browser resource utilization
- Duck Duck Go Browser resource utilization
- System update service error
- Shadow copy on C: full
- Service(s) timed out
- Physical drive error
- Application stopped responding
- Secure Boot is not enabled
- Windows update failed
- Sophoos error requires attention
- Intune error
- Domain Controller not available
- Unstable application
- Possible time error*
- Performance reduction*
- Service failed to start
- Out of memory
- DNS issue
- USB Issue
- Network adapter issue
- Driver loading issue
- BSOD / Unexpected Restart
- Unresponsive component (typically power driver, firmware)
- Graphical component failed to power on (often hardware or dock)
- Memory access issue (bad RAM, Driver bug, temperature, unstable hardware)
- Defective RAM or corrupt system/drivers run sfc /scannow and memory tests
- Disk health issue
- Faulty RAM or corrupt AV/drivers
- Driver or kernel issue
- Driver or firmware issue with sleep/resume
- Bad driver or hardware
- Buggy driver
- Critical process crashed. Run SFC/DISM,AV,chkdsk
- Driver failed during sleep/hibernate/resume
- Memory corruption or possible firmware/driver issue
- System file integrity issue
- Buggy drivers or hardware
- Security check failed run SFC/DISM, AV, update drivers
- GPU stopped responding
- Memory locked too long
- Graphics driver stuck in loop
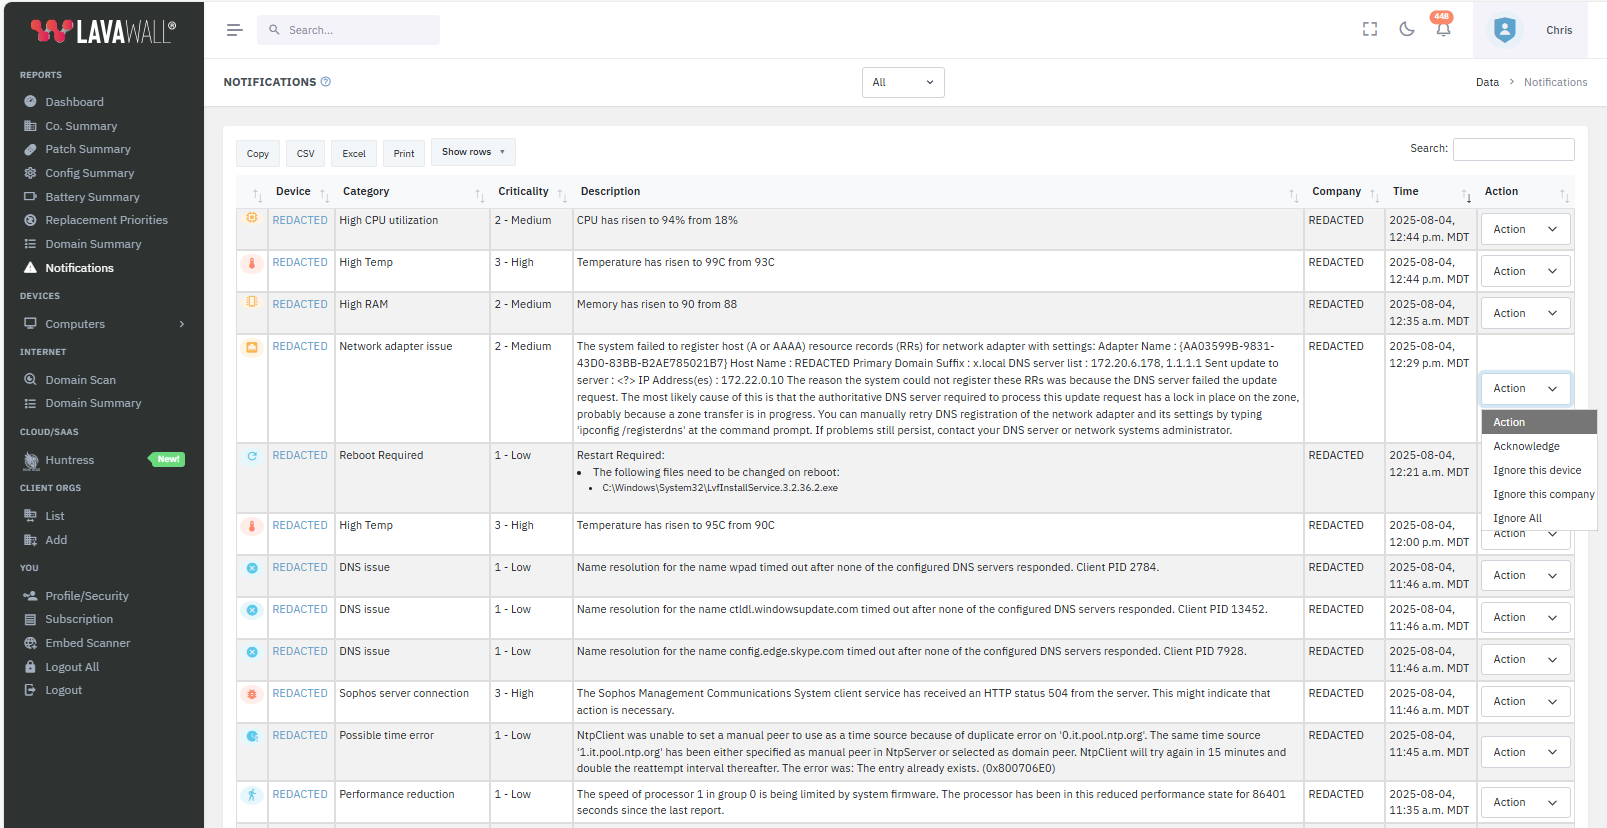
 *Items marked with an asterisk do not appear in the most recent list in the notification drop-down; however, they do appear in the category and stand-alone View All notification view off of the left-side menu
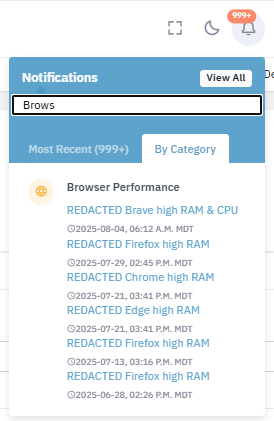
Notifications
The bell icon in the top right (beside the profile drop down) gives you quick access to recent notifications, including those listed above. You can view all computers affected in certain categories or in chronological order from the most recent notifications. You can also quickly search for events by keywords or computer names/nicknames.This quick-access notification list only shows the most recent 999 events and omits some very frequent notifications, such as Network Time Protocol (NTP) synchronization (which we label as "possible time error") and processor auto-throttling (which we label as "performance reduction").
Detailed Notifications
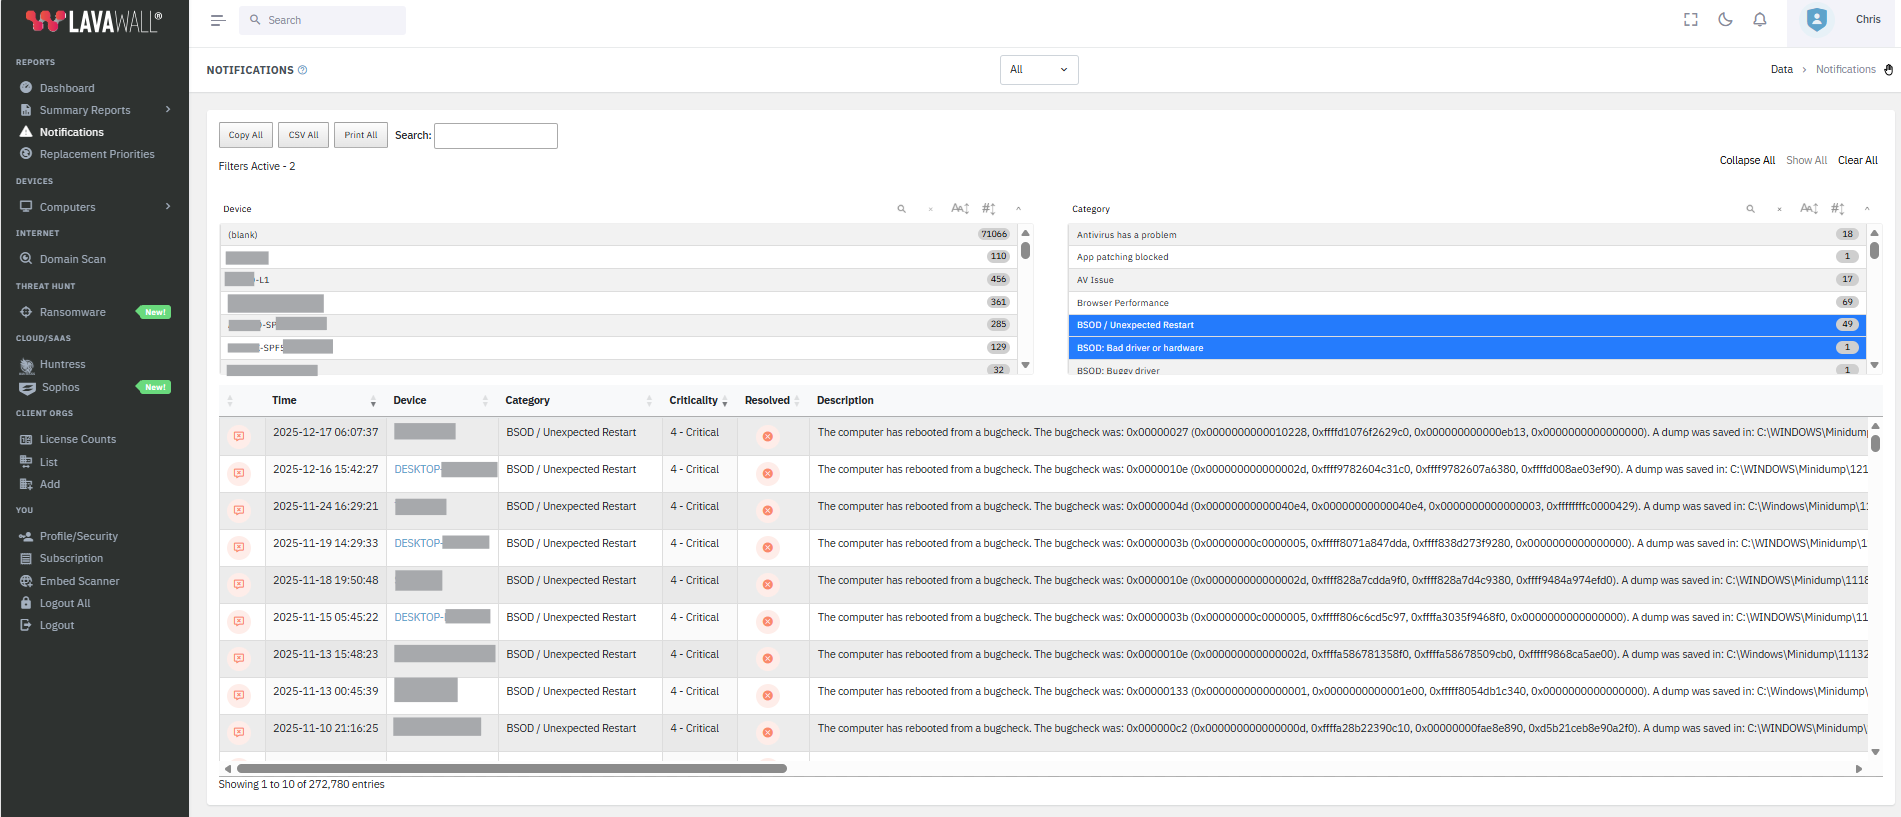
For speed purposes, only the latest 999 notifications are loaded into the quick access menu. For all of the other notifications, please use the Notifications option on the left side menu.This view allows you to sort by device, category, criticality, description, company, and time.
It also allows you to see notification details right away, including why computers need to reboot.
Key log highlights from the Event Log tab are also included in the detailed notification page.
Since these notifications can be included in your notification email digests, you can also choose to ignore known issues that you no longer need to be alerted about from this page.
Process Statistics
Don't wait for Task manager to open up and collect information. Get an instant view of the processes that use the most CPU and RAM on a device, including a graph that shows the trend for that process over the last 24 hours.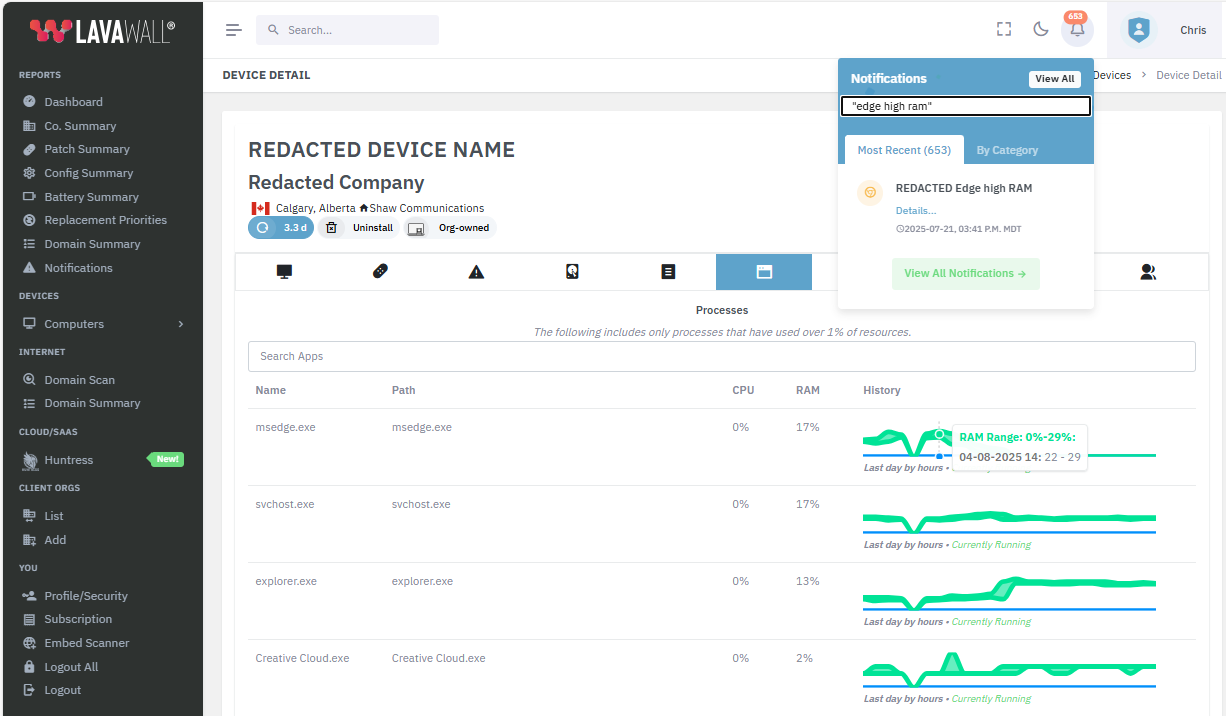
You can mouseover the graph to see the details for CPU and memory. We only record processes that use at least 1% of RAM or 1% of CPU.
Under the chart, you will see a green indication if the process is currently running.
Processes that have historically consumed more than 1% of resources are listed below. (If they aren't currently running, they will show 0% under CPU and RAM and wil not have the Currently Running comment.
You can also quickly search for processes by either their executable name or the program name in the search box, which updates the table with every keystroke.
Comprehensive Statistics
In the device details, you can quickly see CPU, RAM, Network (in and out), storage, and temperature trends.Periods when the computer was off are indicated by a grey overlay.
Note that the graph loads from most recent to the past and will continue to load older data. The most recent date is the last time the computer was connected.
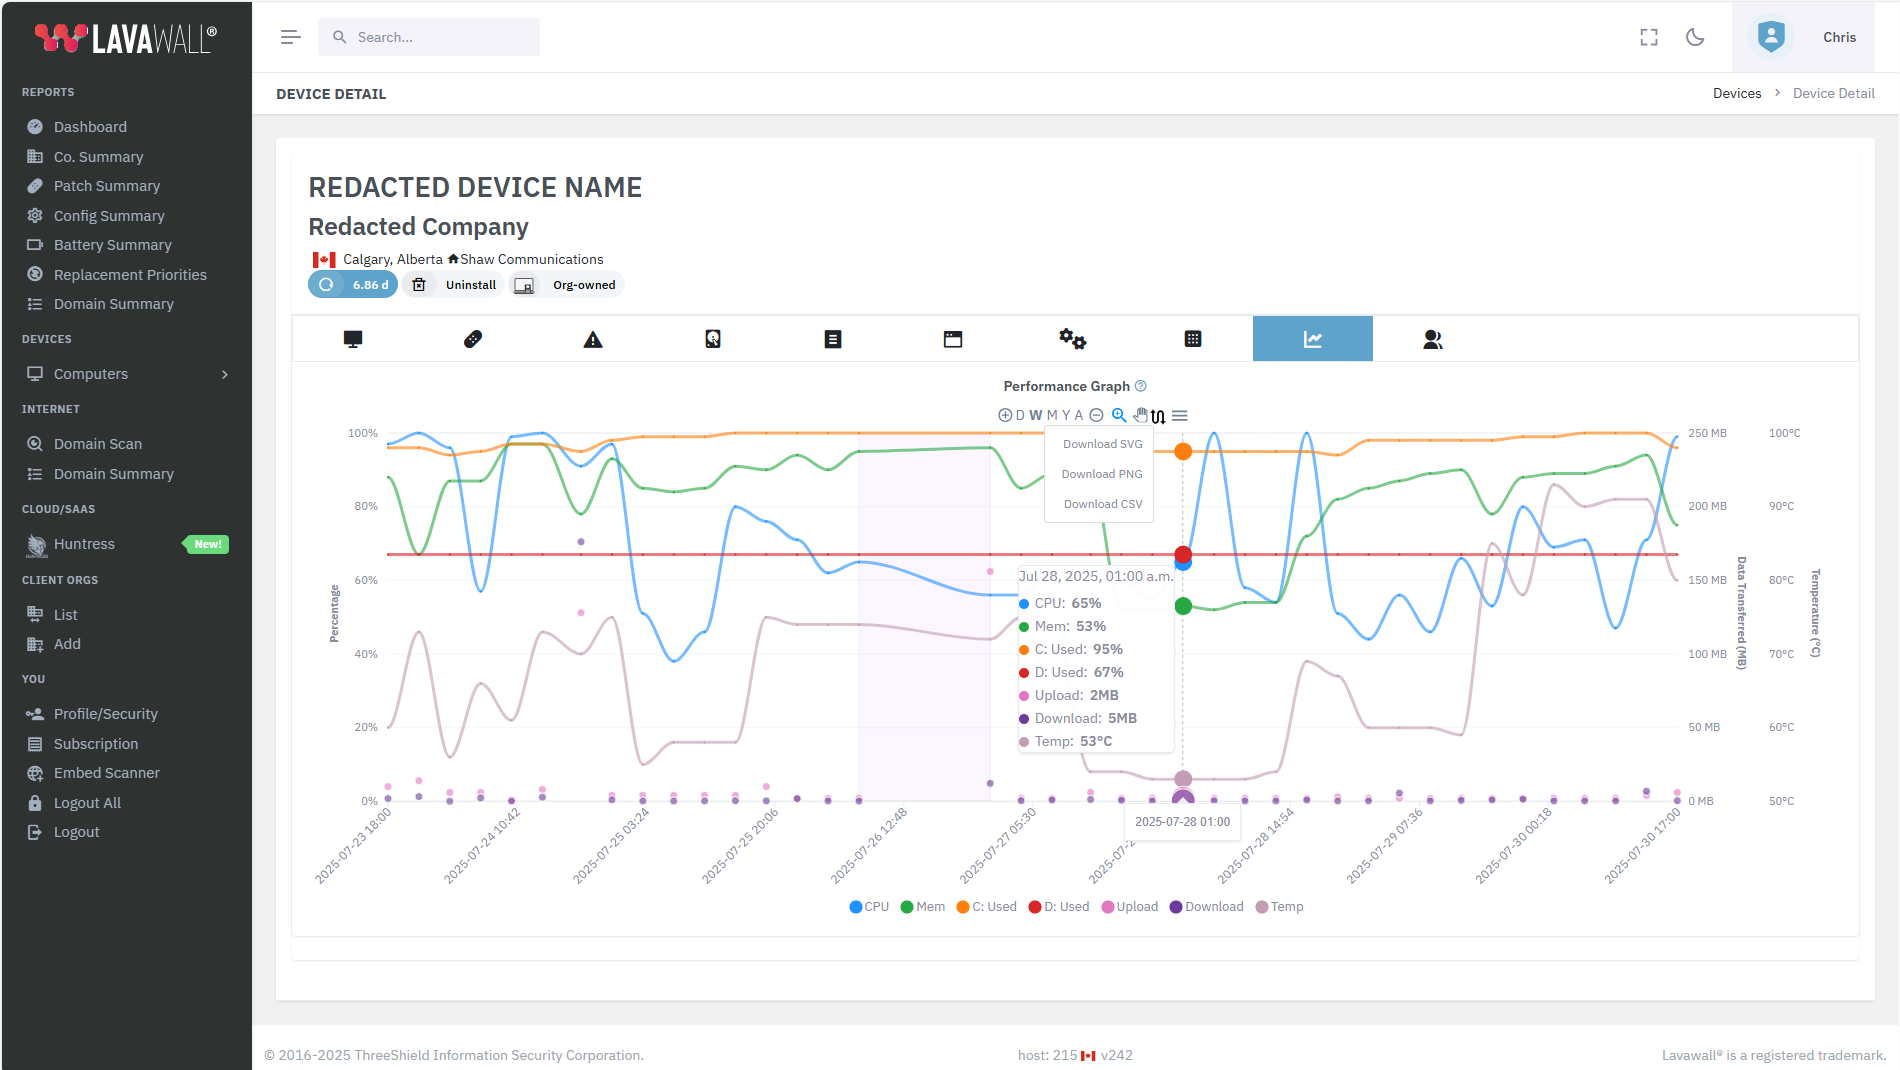
Mouseover any point in time to see the detailed statistics.
to zoom in.
Click then select any area of the graph to zoom into that area
Click to zoom out.
Click D for the last day the computer was online.
Click W for the last week the computer was online.
Click M for the last month the computer was online.
Click Y for the last year the computer was online
Click and then drag the chart left and right to scroll if you're zoomed in.
Click and then download the graph or related data in SVG, PNG, or CSV format. CSV downloads the minimum and maximum values.
Click
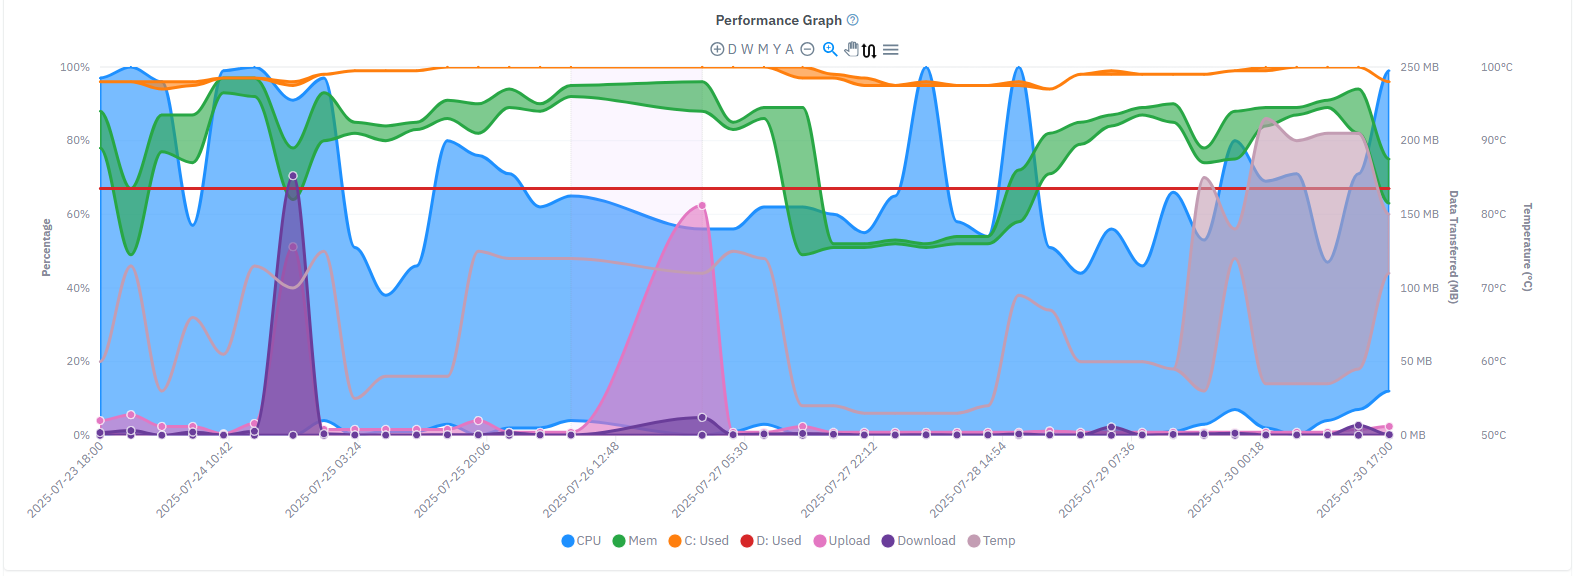
 to see the ranges during each sample period (Lavawall® keeps track of the minimum and maximum over each 15-minute period, but only displays the maximum unless you click this mode).
This is an example of the range view:
Quick Performance View
The Performance column in the device listing page gives a quick view of performance trends over the last 24 hours.Blue shows the CPU range in each 15-minute period
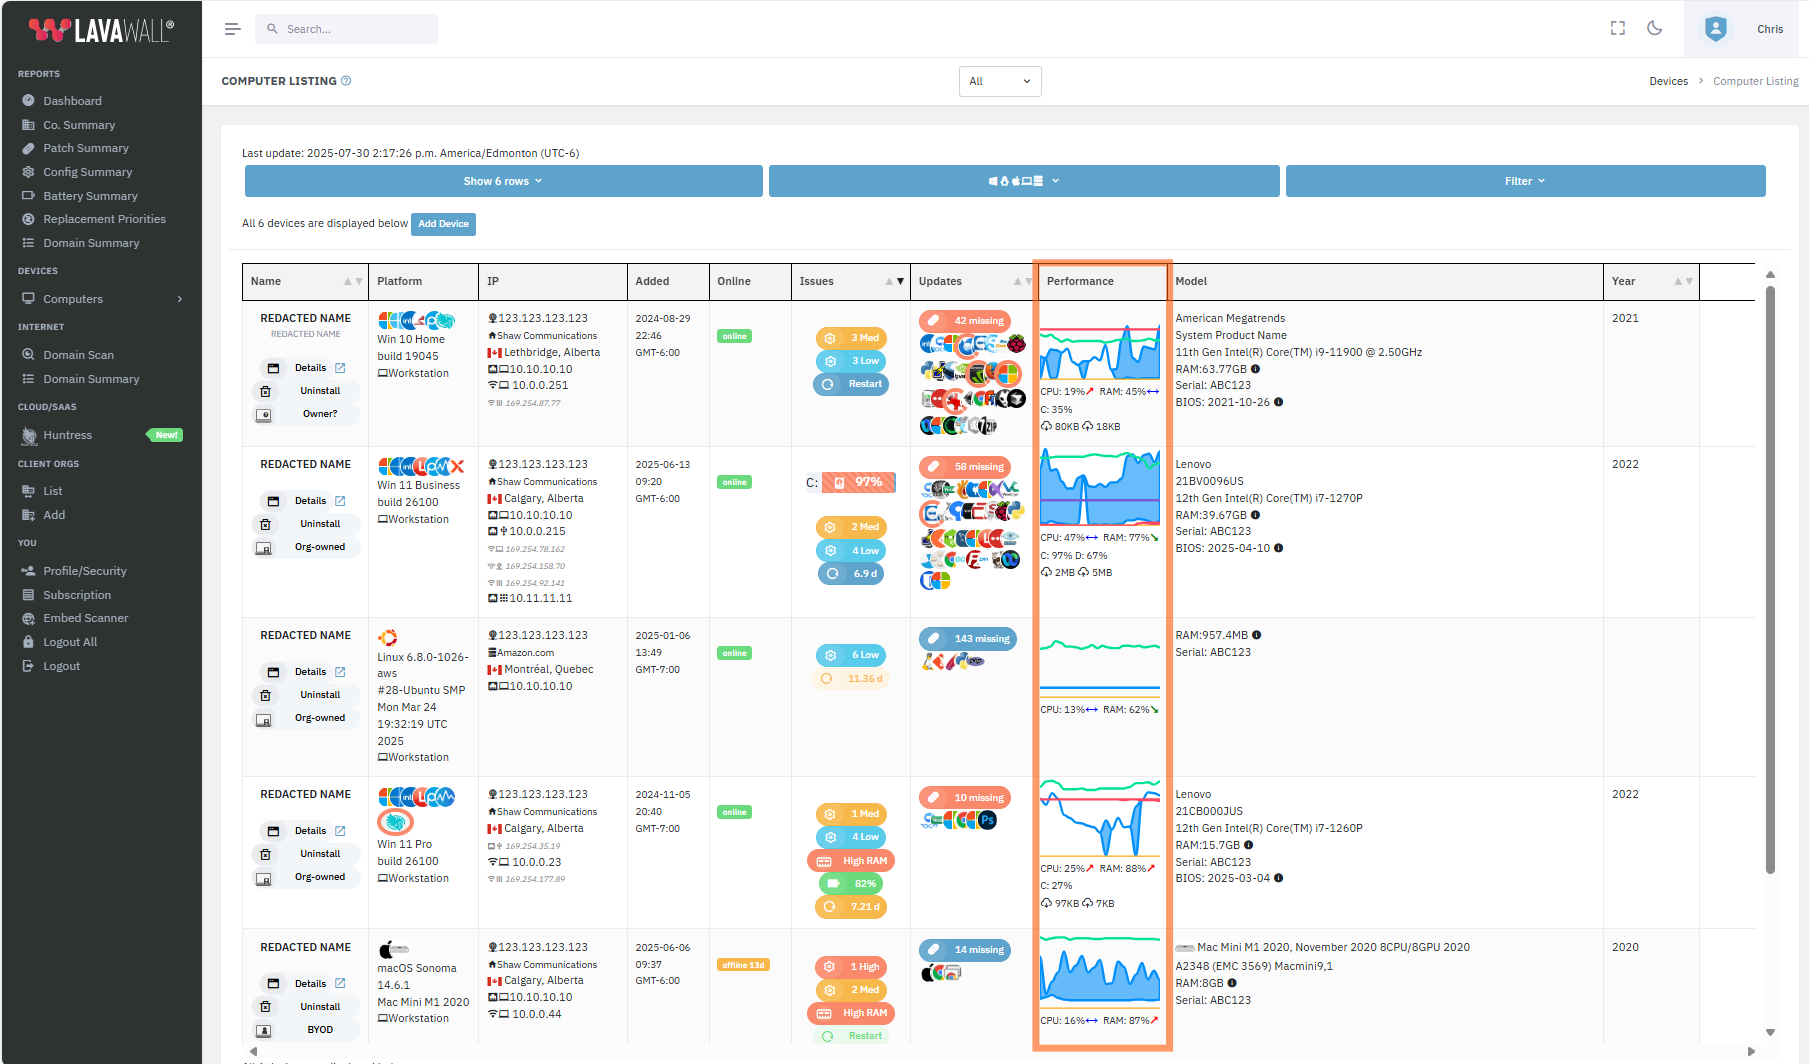
Yellow is the total network traffic trend (Note: In this view, network is the amount of data in that period. In the detail view, it's the amount of data since the last reboot)
Red is the primary storage drive
Purple is the secondary drive.
You can mouseover the lines to get quick details or click the graph to go immediately to the detailed graph tab shown above.

Under the graph, you can see the current CPU and RAM utilization as well as the trend over the last half hour. This is useful to catch memory leaks and infinite loops.
When CPU utilization is currently 0%, it is not displayed in this view; however, it is displayed in the detailed view.
Below CPU and RAM, you can see the current C: and D: drive capacity as well as the amount of data downloaded and uploaded.
Drive utilization and network transmission is shown for Windows in the current mainstream release.
We are adding Mac and Linux in the next release.
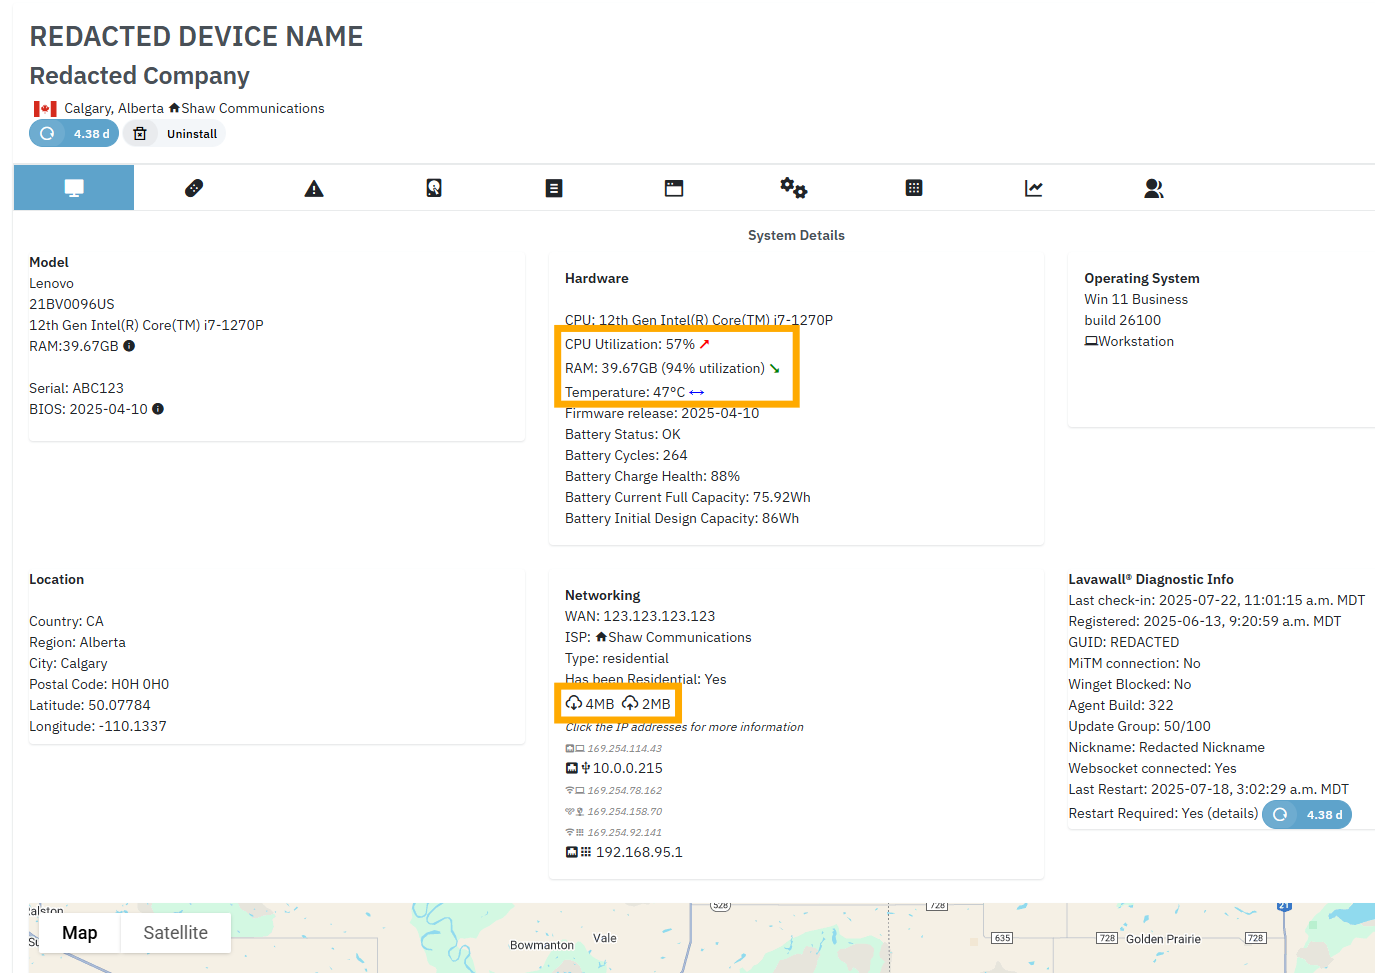
This information is also available in device detail by clicking the Details button in computer listing or searching for the device in the Search box at the top of the screen.
If you have any questions or need further assistance, feel free to reach out through our chat, phone or email on our contact page!